Small cap quality vs junk
Higher quality small caps outperform junk.

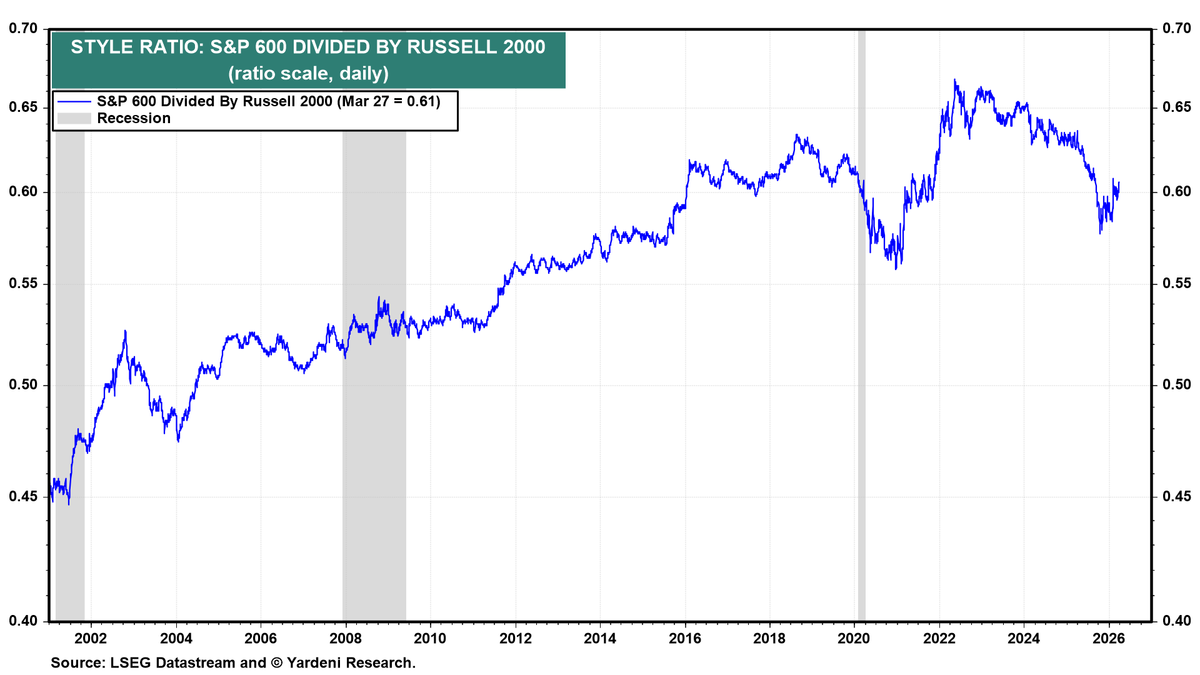
The long-term trend is quality outperforming junk inside small caps.
When this ratio:
- Falls → junk/speculative names outperform
- Rises → quality outperforms
The ratio rises from ~0.45 (early 2000s) → ~0.67 (2022 peak). That’s structural outperformance of S&P 600 vs Russell 2000
Why?
- S&P 600 requires profitability
- Russell 2000 includes a lot of junk / unprofitable names
👉 This is the Quality Minus Junk (QMJ) effect inside small caps
2020–2021 "Meme Stock" Bubble
2021 trough to ~0.55 was:
- Zero rates → speculative boom (2020–21)
- Then sharp tightening → junk collapse
👉 Classic “junk rally → junk crash → quality dominance” cycle
2023–2025 "A.I." Bubble
Ratio falls from ~0.66 → ~0.58
- Lower-quality names outperformed in speculative boom
- High-quality names outperformed since late 2025 junk collapse
👉 Another classic example of the “junk rally → junk crash → quality dominance” cycle
Today
We’re in a “risk-on / early-cycle” phase inside small caps
- When ratio is high (like 2022) → quality crowded → future returns compress
- When ratio falls (like now) → dispersion reopens → opportunity builds
Quality is relatively cheap again.
This chart is saying:
- Structural truth: Quality small caps beat junk over time
- Cyclical reality: Junk periodically outperforms during easing/liquidity phases
- Current setup: We’re in a quality rebound phase
👉 Which means, the next major move is likely continued quality leadership as macro tightens and earnings dispersion reasserts.