Past as prelude: Small and mid cap
Another part of the small versus big cycles (Part 1, Part 2) is the relationship of the biggest stocks to mid caps and small caps.

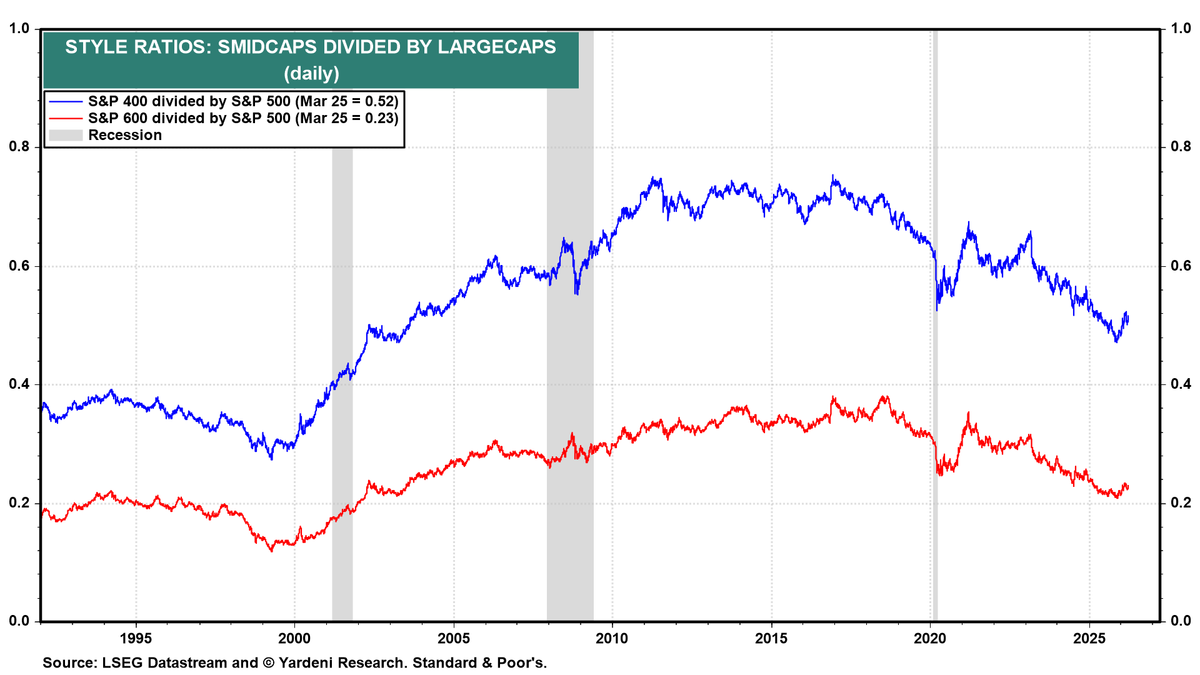
The chart shows:
- Blue line: mid-caps vs large caps (S&P 400 / S&P 500)
- Red line: small caps vs large caps (S&P 600 / S&P 500)
When the lines rise, small and mid caps outperform. When the lines fall, mega caps dominate.
Over the very long run, small and mid caps outperform. But bigger stocks can dominate small and mid for long cycles:
- Mid 1990s to 1999 (Dot Com bubble): big stocks dominate
- 2000–2015 (Golden age of value): small and mid caps massively outperform
- 2015–2025 (Web 2.0, social, meme stocks, A.I.): Large caps dominate (especially mega-cap tech)
👉 We’ve been in a decade-long mega-cap dominance cycle, but smalls and mids seem to have turned up recently.
This is early-stage transition behavior. When both smalls and mid caps trough-and-bounce together, we are at major turning points for multi-year regime shifts.
It's not yet confirmed—but it looks very similar to 2000 topping process
The asymmetry is enormous. From these levels historically:
- Upside for mega-cap dominance is limited
- Downside (reversal) is very large
And when it reverses:
- Small/mid caps outperform sharply
- Cyclicals lead
- Value wins
We are likely in the early stage of a small and mid cap outperformance regime. Historically, similar extremes (e.g., 2000) preceded multi-year periods of outperformance for value and cyclicals.
It is very early in the rotation. As we shift away from mega-cap dominance, small and mids, value and cyclicals likely outperform.