History repeats: Small and mid earnings and multiples
Small and mid cap stocks underperformed big stocks from 2015 to 2025, as we documented here, here and here.
The underperformance didn't happen in a vacuum. There are two reasons for the underperformance:
Multiples
- In 2010, small and mid stocks became unusually expensive relative to big stocks.

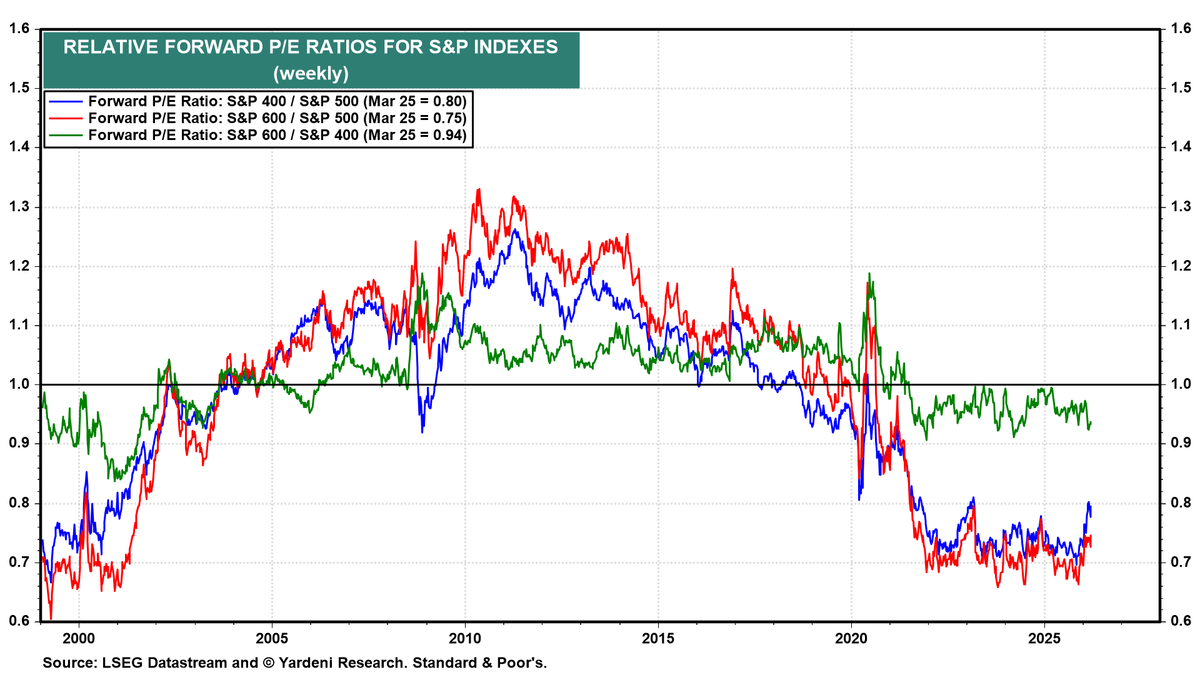
This chart shows the relative forward P/E ratios of three indexes from 1999 to today:
- mid caps / big stocks → S&P 400 / S&P 500 (blue)
- small caps / big stocks → S&P 600 / S&P 500 (red)
- small caps / mid caps → S&P 600 / S&P 400 (green)
Key observations
- From 2000 to 2010, the forward P/Es of small and mid caps rose relative to big stocks:
- Small caps started at 0.7x and ended at 1.34x, almost a double
- Mid caps started at 0.74x and ended at 1.26x forward P/E of big stocks, a +70 percent tailwind
- From 2010 to 2025, small and mid caps fell relative to big stocks:
- Small caps started at 1.34x and ended at 0.66x, falling by more than half
- Mid caps started at 1.26x and ended at 0.7x, almost halving
- Today, small and mid caps are historically cheap vs big stocks
- Small caps at ~0.74x forward P/E of large caps
- Mid caps at ~0.79x
This is near multi-decade lows:
- comparable to late 1999–2000
- significantly cheaper than the pandemic panic
Earnings
P/E multiples only tell half the story. The second half of the story is earnings.
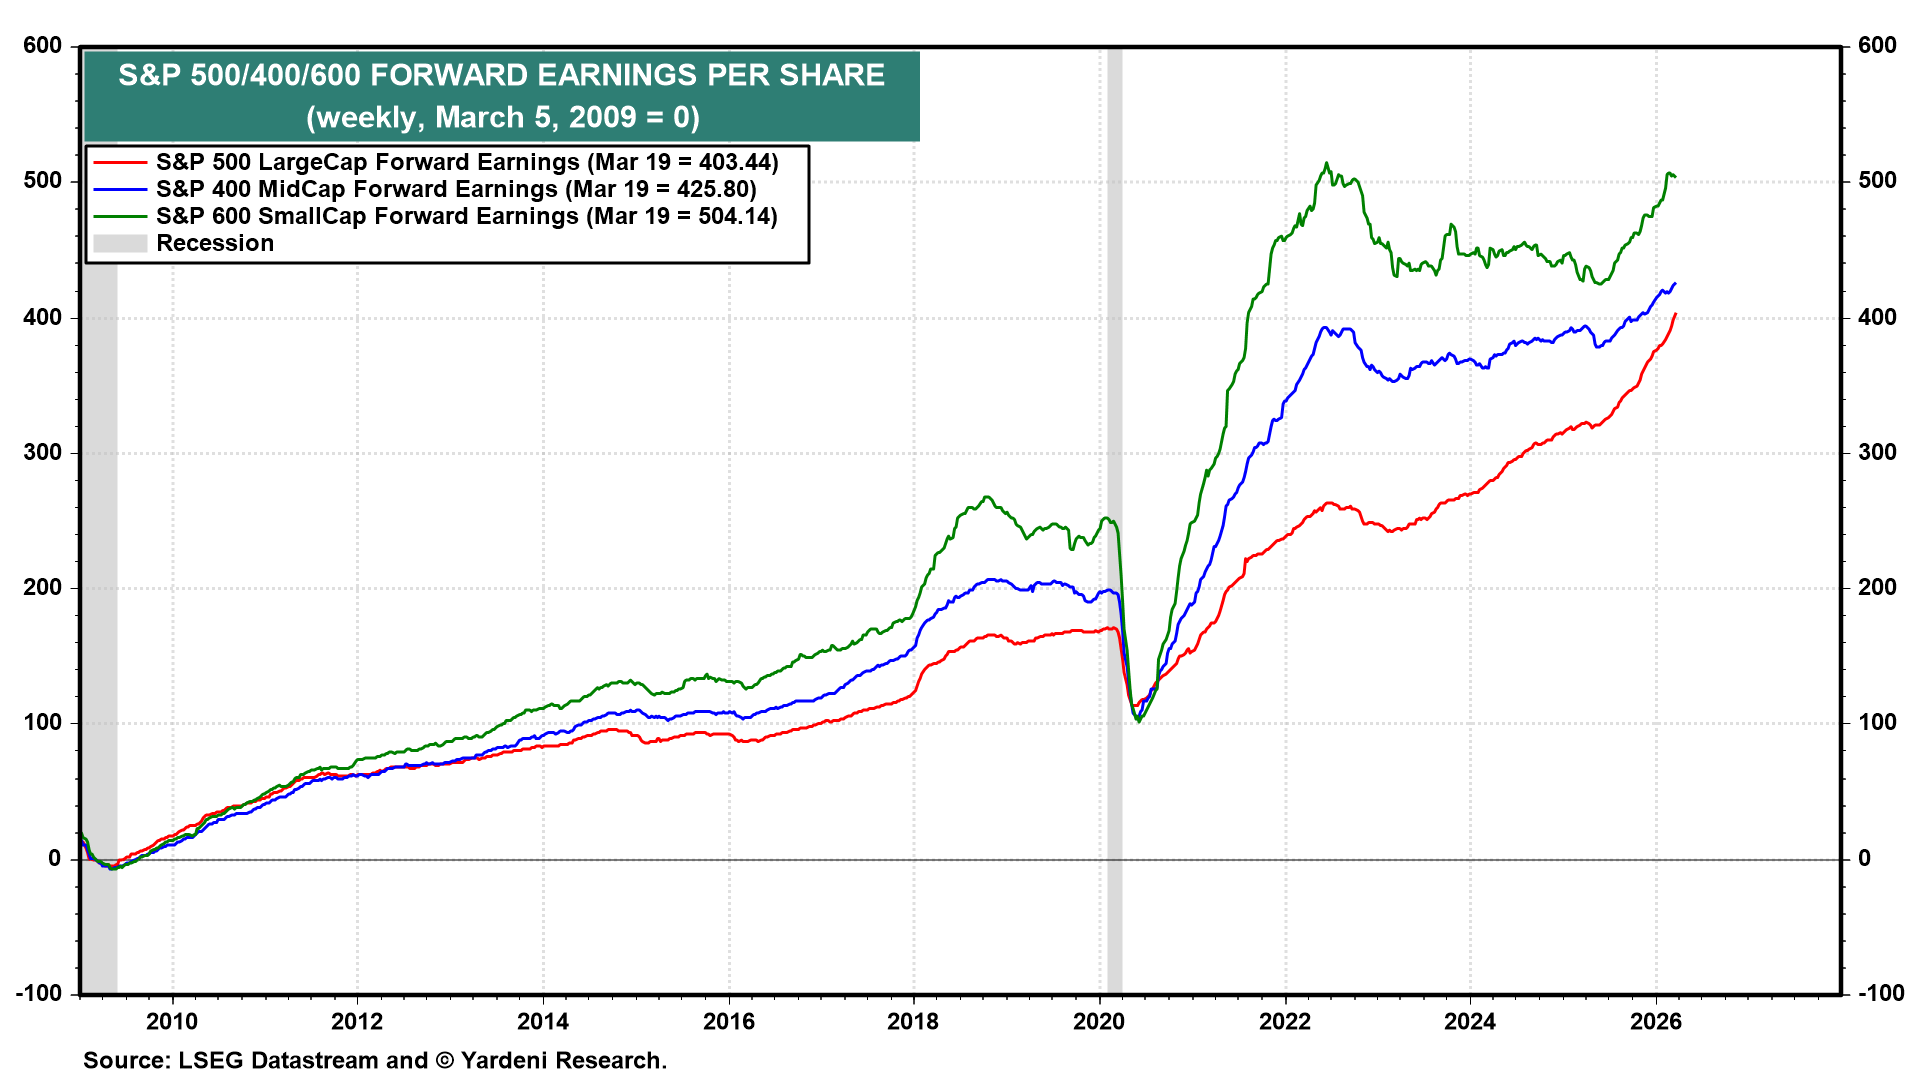
This chart shows forward earnings per share since 2009 for three indexes:
- S&P 600 (small caps, green) → ~500+
- S&P 400 (mid caps, blue) → ~425
- S&P 500 (large caps, red) → ~400
Key observations
- Small and mid caps have delivered the strongest earnings growth
- Both have consistently outperformed in earnings growth, but not price.
- COVID reset hit all equally—but recovery diverged
- Post-2020: small caps exploded higher fastest.
- Earnings cyclicality is much higher in small and mid.
- Recent trend (2023–2026)
- Earnings initially fell for small and mids, while big stocks leapt higher
- Small and mid-caps are now re-accelerating after a pause
Implications
Small and mid cap underperformance is NOT due to weak earnings.
- Earnings growth: Small > Mid > Large
- But price performance: Large > Mid > Small (last few years)
The gap is multiple distortion.
Market is paying a premium for perceived safety / duration (mega caps) and ignoring actual earnings growth + cash flow in smalls and mics.
This is a 2000-style setup. Valuation dispersion is extreme. Like 2000:
- large cap growth is expensive.
- small/mid cheap despite solid fundamentals
This is what led to the multi-year small and mid cap outperformance from 2000 to 2015.
Small and mid caps are growing earnings faster than large caps, but trading at massive discounts. This is a classic setup for a regime shift in relative performance.